Double X and XY Axis Context Managers
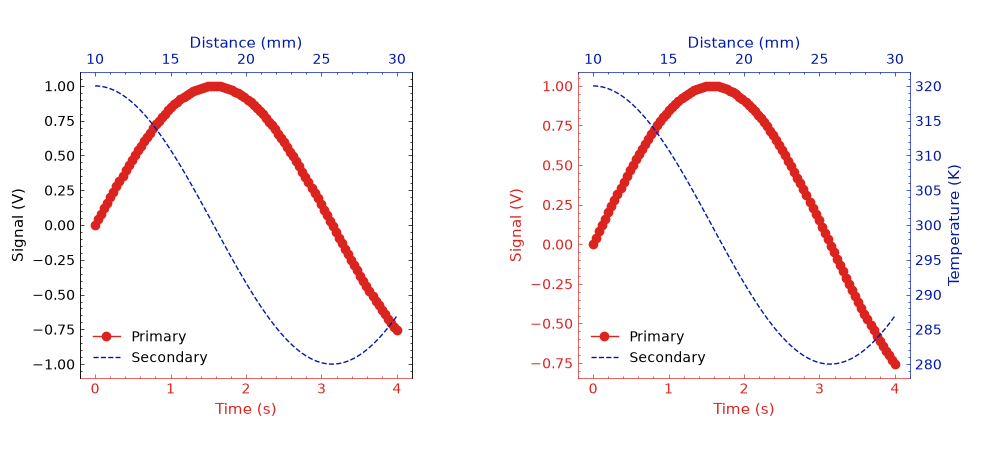
stonerplots.DoubleXAxis adds a top x-axis with an independent scale,
sharing the original y-axis. stonerplots.DoubleXYAxis adds independent
top x and right y scales. Both return a single Matplotlib Axes for plotting
the second dataset. See Double-axis context managers for
an overview of all three variants and their shared options.
Basic Usage
Use DoubleXAxis when two datasets have different horizontal coordinates
but share a vertical scale:
import matplotlib.pyplot as plt
from stonerplots import DoubleXAxis, DoubleXYAxis

fig, ax = plt.subplots()
ax.plot([0, 1, 2], [0, 1, 0], label="Primary")
ax.set(xlabel="Time (s)", ylabel="Signal (V)")
with DoubleXAxis(ax=ax, colours=("central", "piccadilly")) as ax2:
    ax2.plot([10, 20, 30], [0, 0.8, 0], label="Secondary", color="piccadilly")
    ax2.set_xlabel("Distance (mm)")
Use DoubleXYAxis when both coordinates require separate scales:
fig, ax = plt.subplots()
ax.plot([0, 1, 2], [0, 1, 0], label="Primary")
ax.set(xlabel="Time (s)", ylabel="Signal (V)")
with DoubleXYAxis(ax=ax, colours=("central", "piccadilly")) as ax2:
    ax2.plot([10, 20, 30], [100, 200, 100], label="Secondary", color="piccadilly")
    ax2.set(xlabel="Distance (mm)", ylabel="Temperature (K)")
The XY variant creates exactly one extra axes. Its x and y limits, scales, locators and formatters are independent of the primary axes. The two datasets occupy the same plotting rectangle; no coordinate conversion is implied.
Options
ax=None uses the current axes. By default, the secondary axes becomes current
inside the context, so pyplot calls such as plt.plot target it. Exit restores
the previously current figure and axes. Set switch_to_x2=False or
switch_to_xy2=False respectively to keep using the previously current axes;
the returned secondary axes is still available for explicit plotting.
legend=True merges handles from both axes on exit. loc="best" considers
both datasets for placement; a named or integer location is also accepted.
legend=False leaves existing legends alone.
colours accepts the same comma-separated strings, lists and tuples as
DoubleYAxis. The first entry colours the primary axes and the second colours
the secondary axes. DoubleXAxis colours bottom/top x spines, labels and
ticks; DoubleXYAxis colours both bottom/left and top/right. Use None
entries to retain existing colours. Dataset colours are set separately when
plotting. List and tuple inputs containing one colour apply it to the secondary
axes; string inputs retain the existing DoubleYAxis parsing rules.
Illustrated Example
Run examples/plot_examples/double_axes.py to generate this comparison: