Double-Axis Context Managers
The double-axis context managers overlay a second plotting axes on the original plot frame. They let two related datasets use different scales while sharing the same plotting area. Choose the manager according to the coordinates that need independent scales:
Context manager |
Independent scales |
Shared coordinate |
|---|---|---|
Left and right y-axes |
x |
|
Bottom and top x-axes |
y |
|
Bottom/left and top/right axes |
Neither x nor y |
All three return a single secondary matplotlib.axes.Axes for plotting
the second dataset. With DoubleXYAxis, both coordinates of that secondary
axes are independent: limits, scales and tick settings can be changed without
changing the original axes. No conversion between the datasets’ coordinates
is implied.
Basic Usage
Plot the first dataset on the original axes, then use a double-axis context for the second. This example adds a right y-axis with a common x coordinate:
import matplotlib.pyplot as plt
from stonerplots import DoubleXAxis, DoubleXYAxis, DoubleYAxis

fig, ax = plt.subplots()
ax.plot([0, 1, 2], [0, 1, 0], color="central", label="Signal")
ax.set(xlabel="Time (s)", ylabel="Signal (V)")
with DoubleYAxis(ax=ax, colours=("central", "piccadilly")) as ax2:
    ax2.plot([0, 1, 2], [280, 300, 290], color="piccadilly", label="Temperature")
    ax2.set_ylabel("Temperature (K)")
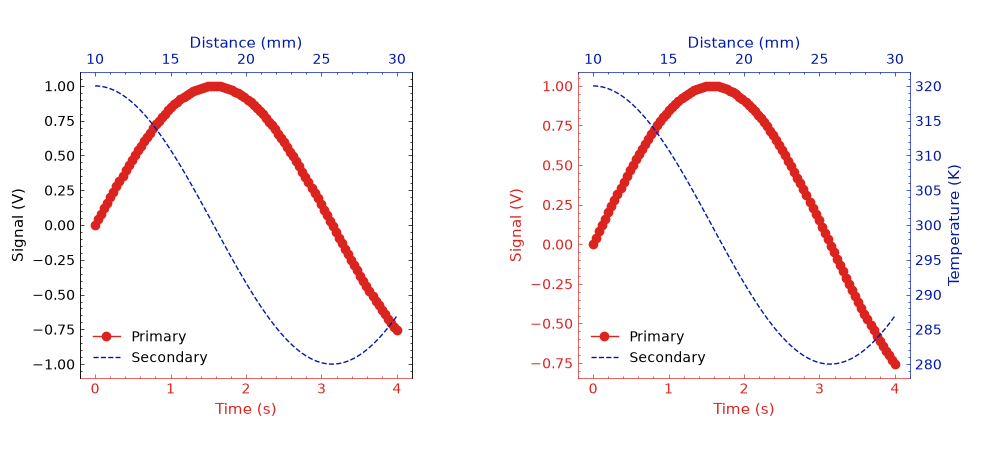
Use DoubleXAxis for independent bottom and top x scales with a common y
coordinate. Continuing with the imports above:
fig, ax = plt.subplots()
ax.plot([0, 1, 2], [0, 1, 0], color="central", label="Primary")
ax.set(xlabel="Time (s)", ylabel="Signal (V)")
with DoubleXAxis(ax=ax, colours=("central", "piccadilly")) as ax2:
    ax2.plot([10, 20, 30], [0, 0.8, 0], color="piccadilly", label="Secondary")
    ax2.set_xlabel("Distance (mm)")
Use DoubleXYAxis when both coordinates need separate scales:
fig, ax = plt.subplots()
ax.plot([0, 1, 2], [0, 1, 0], color="central", label="Signal")
ax.set(xlabel="Time (s)", ylabel="Signal (V)")
with DoubleXYAxis(ax=ax, colours=("central", "piccadilly")) as ax2:
    ax2.plot([10, 20, 30], [280, 300, 290], color="piccadilly", label="Temperature")
    ax2.set(xlabel="Distance (mm)", ylabel="Temperature (K)")
Legend Control
The shared legend option defaults to True. On exit, the context removes
existing legends from both axes and creates a merged legend on the original
axes. Set legend=False to leave existing legends alone.
loc="best" chooses a location using the contents of both axes. A named
location such as "upper left" or a Matplotlib integer location code can
also be supplied.
Colouring the Axes
colours controls the independent axes’ spines, tick marks, tick labels and
axis labels. It accepts a comma-separated string, list or tuple. With two
entries, the first colours the primary scales and the second the secondary
scales:
DoubleYAxiscolours the left and right y scales.DoubleXAxiscolours the bottom and top x scales.DoubleXYAxiscolours both bottom/left and top/right scales.
For example, colours=("central", "piccadilly") colours the primary scales
red and the secondary scales blue. Dataset colours are set separately when
plotting. None entries leave the corresponding scales’ colours unchanged.
A one-element list or tuple, such as colours=("piccadilly",), colours only
the secondary scales. A single-colour string retains the existing parsing
behaviour and colours the primary scales; use a two-element sequence with
None for an explicit choice, such as colours=(None, "piccadilly").
Parent Axes and Pyplot State
ax selects the primary axes. The default, None, uses the current axes.
By default, the secondary axes becomes current inside the context, so pyplot
calls such as plt.plot target it. On exit, the previously current figure
and axes are restored. The returned secondary axes remains available for
explicit plotting after the context ends.
Each manager has a corresponding option for disabling the automatic switch:
DoubleYAxis(switch_to_y2=False)DoubleXAxis(switch_to_x2=False)DoubleXYAxis(switch_to_xy2=False)
With switching disabled, pyplot continues to use the previously current axes.
Use the Axes returned by the context to plot the secondary dataset.