Offsetting Related Datasets
The stonerplots.OffsetPlots context manager separates related datasets
vertically on the same axes. It inspects the artists when the context exits,
so ordinary Matplotlib plotting commands need no changes:
import matplotlib.pyplot as plt
from stonerplots import OffsetPlots, SavedFigure

with SavedFigure("offset.png"), OffsetPlots(offset=2):
    fig, ax = plt.subplots()
    for y in datasets:
        ax.plot(x, y)
        ax.scatter(x, y)
On each new axes, the first dataset stays in place and successive datasets have
offset, 2 * offset, etc. added to their y values. The default offset is
1 in y data units. Negative offsets stack downwards. This changes the artists’
data without modifying the arrays passed to Matplotlib.
Logarithmic Axes
If the y scale is logarithmic at context exit, factor replaces the additive
offset. The first dataset stays in place and successive datasets are multiplied
by factor, factor ** 2, etc. The default factor is 10:
with OffsetPlots(factor=5):
    fig, ax = plt.subplots()
    ax.set_yscale("log")
    for y in datasets:
        ax.plot(x, y)
The factor must be finite and positive. A factor between 0 and 1 stacks
downwards. Set both offset and factor when creating linear and log axes
in the same context; each axes chooses the appropriate setting independently.
Pairing and Artist Selection
By default, pair="auto" checks the number of line datasets and scatter
collections on each axes. If there are equal, nonzero numbers of both, the first
line is paired with the first scatter collection, and so on. Each pair receives
the same adjustment, even when all lines are drawn before all scatter points.
Pairing uses the order within each artist type, rather than labels or colours.
pair=Falsetreats every dataset separately, in overall creation order.pair=Truerequires equal, nonzero counts on every nonempty eligible axes. A mismatch raisesValueErrorbefore any datasets are moved.lines=Falseexcludes lines and errorbar plots.scatter=Falseexcludes scatter collections.errorbars=Falseexcludes complete errorbar plots, including their data lines.
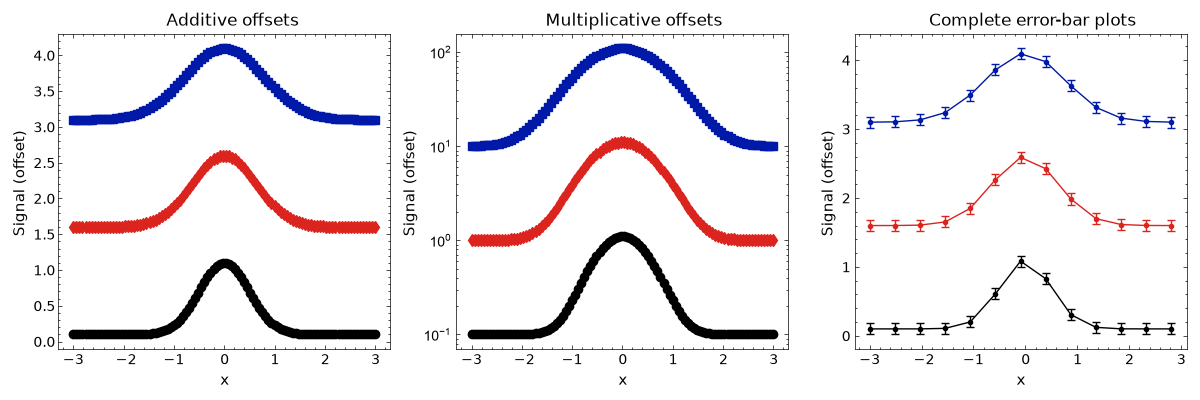
An ax.errorbar() plot counts as one line dataset. Its data line, caps, and
horizontal and vertical error segments all move together, including when
fmt="none" suppresses the data line. Additive offsets preserve the error
size; multiplicative factors scale the y-error size with the y values. The
x values and x-error widths remain unchanged.
For example, three measurement series with uncertainties can be stacked without manually adjusting either their values or their error bars:
with OffsetPlots(offset=1.5):
    fig, ax = plt.subplots()
    for y, uncertainty in measurements:
        ax.errorbar(x, y, yerr=uncertainty, fmt="o-", capsize=3)
An errorbar plot and a separately drawn fit both count as line datasets, so they are offset independently. Automatic pairing matches line datasets with scatter collections.
Axes Discovery and Limits
Only axes created within the context are processed by default, including axes
added to an existing figure. Use include_open=True to process all open axes,
including artists drawn before entering the context. Each axes starts a fresh
offset sequence. A single dataset remains unchanged.
Data and view limits are refreshed after moving the artists, including scatter
and error-bar collections. Explicit limits and disabled autoscaling are
respected. The previously current figure and axes are restored on exit.
If plotting raises an exception, the manager leaves the datasets untouched and
propagates the exception. A manager can be reused; previously adjusted artists
selected again with include_open=True receive another adjustment.
Only ordinary 2D Cartesian axes with linear or logarithmic y scales are handled.
Polar and 3D axes and other y scales are skipped. Lines and scatter collections
must use data coordinates. Reference lines such as axhline() and axvline(),
filled regions, images and other artist types are left in place. Empty ordinary
line and scatter artists are ignored.
The executable example examples/plot_examples/offset_plots.py demonstrates
paired measurements and fits on both linear and logarithmic axes.
"""Offset paired measurements and fits on linear and logarithmic axes."""

import matplotlib.pyplot as plt
import numpy as np
from common import figures

from stonerplots import OffsetPlots, SavedFigure

x = np.linspace(-3, 3, 100)
sample = np.arange(0, len(x), 8)

with SavedFigure(figures / "offset_plots.png", style="stoner", autoclose=__name__ != "__main__"):
    with OffsetPlots(offset=1.5, factor=10):
        fig, (linear, logarithmic, errors) = plt.subplots(1, 3, figsize=(12, 4))
        logarithmic.set_yscale("log")
        for index, width in enumerate((0.7, 0.9, 1.1)):
            y = 0.1 + np.exp(-((x / width) ** 2))
            for ax in (linear, logarithmic):
                line = ax.plot(x, y, label=f"Dataset {index + 1}")[0]
                ax.scatter(x[sample], y[sample], s=8, color=line.get_color())
            errors.errorbar(x[sample], y[sample], yerr=0.08, fmt="o-", capsize=3, markersize=3)
        for ax in (linear, logarithmic, errors):
            ax.set_xlabel("x")
            ax.set_ylabel("Signal (offset)")
        linear.set_title("Additive offsets")
        logarithmic.set_title("Multiplicative offsets")
        errors.set_title("Complete error-bar plots")
API
- class stonerplots.OffsetPlots(offset: float = 1.0, *, factor: float = 10.0, pair: bool | Literal['auto'] = 'auto', lines: bool = True, scatter: bool = True, errorbars: bool = True, include_open: bool = False)
Bases:
TrackNewFiguresAndAxes,PreserveFigureMixinSeparate datasets on each new axes by a constant y offset or factor.
Inspection and adjustment happen on successful exit. The first dataset is unchanged; dataset
ireceivesi * offseton linear axes or is multiplied byfactor ** ion logarithmic axes. Each axes starts at zero.- Parameters:
offset (float) – Additive step in y data units on linear axes. Default 1.
factor (float) – Positive multiplicative step on log axes. Default 10. Values below 1 stack downwards; negative offsets do likewise.
pair (bool or str) – By default (
"auto"), equal nonzero numbers of lines and scatter collections are paired by their order within each type. False offsets every dataset separately in overall creation order. True requires equal numbers of both types, raising ValueError otherwise (except on empty axes).lines (bool) – Include data-coordinate Line2D artists. Default True.
scatter (bool) – Include data-coordinate scatter collections. Default True.
errorbars (bool) – Include complete errorbar plots as line datasets, including plots with
fmt="none". Default True. Requires lines=True.include_open (bool) – Also process existing axes and their existing artists. Default False, processing only axes created within the context.
Only ordinary 2D Cartesian axes with linear or log y scales are handled. Reference lines using axes coordinates, filled regions, images and other artist types are not shifted. Pairing is positional, not inferred from labels or colours. Empty ordinary lines and scatter collections are ignored.
Artist y data are changed, without changing caller-owned arrays. Limits are recalculated, respecting disabled autoscaling and explicit limits. Reusing the manager applies another offset to the selected datasets.
Example:
>>> with OffsetPlots(offset=2):
...     fig, ax = plt.subplots()
...     for y in datasets:
...         ax.plot(x, y)
...         ax.scatter(x, y)